
The WebApp has built-in analytics and offers a comprehensive set of reports.
To access the reports, go to the left side menu bar and click Reports.
1. Ridership analytics including financial information.
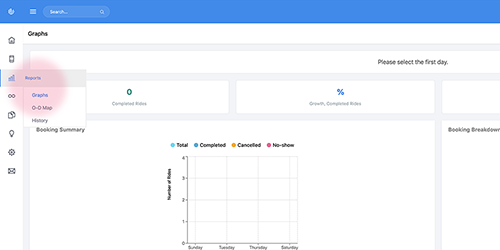
The WebApp provides a set of graphs to help you understand the performance of the services such as ridership, usage, trip distance and time, ride fee, etc.
To view the graphs, click on Display button to select the reporting time window to populate the graph report.

2. Origin and destination (O-D) map.
You can generate an O-D map in the WebApp by clicking the Display button and selecting the time period of the data to be used for the map. The O-D map provides you an easy to understand visual of the travel pattern of the rides for the time period.
When you zoom in or out the view, the map will dynamically recalculating the bubble size to reflecting the next level of details.

3. History
The history table is where you can find the record of the all the bookings or rides with the pickup date as yesterday or earlier.
To view the bookings, click the Display button to select the reporting time window to populate the graph report.

4. Generate reports
To generate a report for your presentation, just click on the Print button to create a pdf file of the graph, map or history displayed on the screen.
Comments
0 comments
Please sign in to leave a comment.